 America’s blue-collar workers may be one of the most optimistic groups in the country today. According to a new study conducted by The Harris Poll and commissioned by Express Employment Professionals, 85 percent of America’s blue-collar workers see their lives heading “in the right direction.”
Sixty-nine (69) percent also say their local communities are heading in the right direction, and 51 percent say the same about the country as a whole. That is 12 percentage points higher than among all Americans who say the country is heading in the right direction (39 percent), according to the July edition of the Harvard-Harris Poll polling average. [i]
The national survey of 1,049 blue-collar workers was conducted online by The Harris Poll between July 9 and 23, 2018, on behalf of Express and offers a detailed, in-depth look at the background and attitudes of those working in blue collar professions.
“There’s been a great deal of chatter about the future and frustrations of America’s blue-collar workers,” said Express CEO Bill Stoller. “Our survey reveals that blue collar workers are upbeat, optimistic and proud of the work they do. While the news is often full of stories about economic anxieties, this survey shows workers who are exceptionally optimistic. While they certainly express concerns, it’s clear that the vast majority feel like things will work out for themselves and their families.”
Who are America’s blue-collar workers?
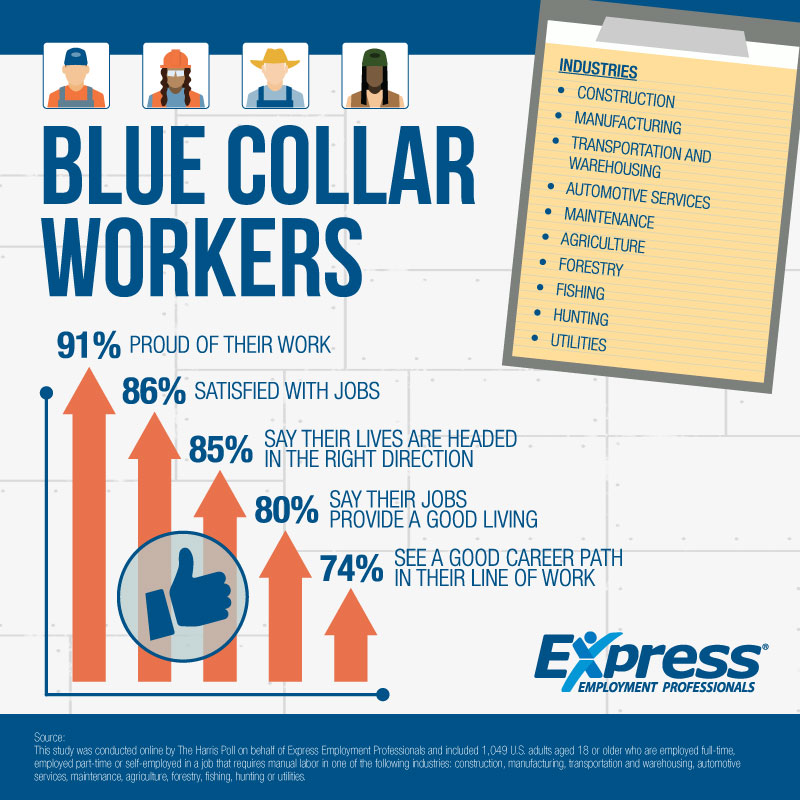
The survey included workers who are employed full-time, part-time or self-employed in a job that requires manual labor in one of the following industries: construction, manufacturing, transportation and warehousing, automotive services, maintenance, agriculture, forestry, fishing, hunting or utilities.
40-hour work weeks, hourly pay, indoors and outdoors
On average, U.S. blue-collar workers have been working for a total of 22 years and in their current jobs for approximately 10 years.
On average, blue-collar workers in the U.S. work about 41 hours per week.
- 8 percent work less than 30 hours per week
- 13 percent work 30 to 39 hours per week
- 60 percent work 40 to 49 hours per week
- 19 percent work more than 50 hours per week
The majority (80 percent) report that they are paid hourly, while 15 percent characterize their pay as salaried, and 5 percent are not sure. Forty-two (42) percent say they work mostly indoors, 23 percent say they work mostly outdoors, 30 percent say their time is split between the two locations, and 5 percent say they work inside a vehicle.
Labor unions: fans but not members
The majority are supportive of labor unions but are not members themselves. Seventy-three (73) percent somewhat or strongly agree that “unions help the working man and woman,” but only 13 percent are members of a labor union.
Low trust in elected officials
Only 30 percent of U.S. blue-collar workers say they trust elected government officials and about half of blue-collar workers (51 percent) believe that the federal government is pro-business (men more so than women, 58 percent vs. 32 percent). Blue collar workers are slightly more likely to identify with the Democratic party, 35 percent vs. 31 percent for Republicans. By a small margin, they think Republicans do a better job of helping blue-collar Americans than Democrats, 39 percent vs. 36 percent. Nearly one in four (24 percent) believe neither party does a better job helping blue-collar Americans.
Split between skilled trade and general labor
Roughly half of blue-collar workers (49 percent) identify their work as a skilled trade, while another 44 percent would describe their work as general labor. Nearly 1 in 5 blue-collar workers (18 percent) say using technology is a significant part of their job.
Blue collar workers say they are “better off,” but are less certain about the country’s direction.
In general, blue collar workers are optimistic about their personal situation and about the future.
- 85 percent say their lives are heading in the right direction
- 69 percent say their local communities are heading in the right direction
- 58 percent say their states are heading in the right direction
- 51 percent say the country is heading in the right direction
Fifty-five (55) percent say they are better off now than they were five years ago.
- 20 percent say they are worse off
- 26 percent say they are about the same
- 61 percent of skilled trade workers say they are better off; 45 percent of general labor workers say they are better off
Among blue-collar workers who are parents, the vast majority believe their children will have a brighter future. Eighty-eight (88) percent of blue-collar parents agree with the statement, “My children will have a better future than I will.” This contrasts with a recent Pew poll showing just 37 percent of Americans believe that today’s children will grow up to be better off financially than their parents. [ii]
Eighty (80) percent of blue-collar workers are optimistic about the future, and more than one-third (34 percent) say they are “very optimistic.” Eighty (80) percent also agree that “the harder you work, the more successful you will be,” and 70 percent agree that “the American dream is alive for people like me.”
But life is not without its challenges. While 84 percent of blue-collar workers say they can make ends meet, nearly half of workers (48 percent) say it is difficult to make ends meet. One in 10 says it is “very difficult.”
The majority say they have less than $5,000 saved for an emergency.
- 14 percent say they currently have no money saved in case of an emergency
- 48 percent say they have between $1 and $4,999 saved
- 23 percent say they have between $5,000 and $24,999 saved
- 11 percent say they have $25,000 or more saved
- 4 percent declined to answer
Nearly three in four workers (73 percent) say they are worried about saving enough for their retirement, and more than half of workers (53 percent) agree that it’s “more likely that Martians will land on earth than I’ll collect Social Security.”
Blue collar workers are satisfied with and proud of their jobs.
Eighty (80) percent agree that “my job provides a good living to financially support my family,” with skilled trade workers more likely than general labor workers to agree with this (85 percent vs. 72 percent).
Overall, 86 percent say they are “satisfied” with their jobs, and 91 percent say they are “proud” of the work they do. Seventy-nine (79) percent agree that “people I know respect the type of work that I do.”
Seventy-four (74) percent see a “good career path” in their line of work, and 64 percent would encourage a friend or family member to pursue a career in their field.
Blue collar workers do express some concerns about their jobs.
- 39 percent agree “it can be dangerous at times”
- 28 percent say there are limited or no advancement opportunities
- 23 percent say there is little to no flexibility in work hours
- 18 percent say they are not making a good “living wage”
Concerns about a living wage are higher among general laborers (25 percent) than among skilled trade workers (13 percent).
Still, the past year has been good for blue collar workers.
- More than two-thirds (68 percent) report a pay increase in the past year
- Of those that saw a pay increase in the last year, 39 percent received a raise of more than 5 percent
- 45 percent report receiving more responsibilities in the past year
- 35 percent report receiving a promotion in the past year
About the Survey
This study was conducted online by The Harris Poll on behalf of Express Employment Professionals and included 1,049 U.S. adults aged 18 or older who are employed full-time, part-time or self-employed in a job that requires manual labor in one of the following industries: construction, manufacturing, transportation and warehousing, automotive services, maintenance, agriculture, forestry, fishing, hunting or utilities.
The survey was conducted between July 9 and July 23, 2018.
Results were weighted as needed by gender for age, education, race/ethnicity, region and household income. Propensity score weighting was also used to adjust for respondents’ penchant to be online. Totals may not equal the sum of their individual components due to rounding. No estimates of theoretical sampling error can be calculated; a full methodology is available.
Survey Methodology and Infographic
No comments yet.